Lessons from the British East India Company, or How To Import/Export
Importing information into Universe is actually pretty easy once you figure out how it works.
The first step involves registering an IEL file. If I had to guess, I would guess it stands for Import Export Language or something, but I actually have no idea. What I do know is that IEL files define the format of the data you are importing or exporting. There are a number of sample files, but you can create a custom one for whatever needs you might have. I needed to create one since the default files didn’t have the name field long enough.
So I created an IEL file that corresponded with the data layout of my preferred .sec file format, using one of the samples as a template and modifying it accordingly. The IEL contains a header section, a section to define the length of the line, a definition of each field with starting character position and field length, and then various lines to define data cleanup options and some parameters. For example:
; IEL created 16-Jun-2010 by Chris

Header="#Version: 2.6"
DetailLine="                                      -                                                           "
Field=system_name,1,25
Field=sector_hex,27,4
Field=starport_code,32,1
Field=size_code,33,1
...
Once I had my IEL, I had to use Traveller Universe Manager to register the file and associate an extension with it, so that when in Traveller Universe I could choose it as my import template. It took some trial and error to get the name right and realize to not include the “.” when entering the extension, and instead just using “sec”. I ended up going into the registry to remove the bad registrations and editing the successful ones so that the extension read as “sec” instead of “SEC” (a personal preference).
HKEY_CURRENT_USER\Software\VB and VBA Program Settings\Traveller Universe\IELs
I ended up with six different IELs so that I could import from or export to the most popular formats for .sec files, in order to maximize my use of external tools with the most minimal effort.
Generation Gap
A while back, I started messing around with a script called SectorMaker I found in a thread on the Citizens of the Imperium forum. The script generates a whole sector at random based on user parameters (and creates a .sec file), or it uses an exisiting .sec file and produces a PDF. It’s a pretty fantastic script to say the least. It was written in Perl and had instructions to install and run on a Mac. Since I didn’t have one, I modified the script and the instructions to run on Ubuntu.
One of the software components the script uses when generating a random sector is called GenSec, which it uses to do what the name implies, and outputs a full .sec file, minus names (the names are “Unnamed”) and stellar data. It has been around for ages
At the time, I knew GenSec could use an additional mode where you could feed it the locations and names of systems, and it would generate the UWP, Base, Codes, Zone, and PBG information for them. So I rewrote the tool in C++, and added options to do just that, and versioned it GenSec4.
GenSec4 was exactly what I needed to generate the missing data for my new sector. I took the original .sec file I exported from Universe with the hex locations and hex number system names that looks like this:
0118                      0118                                             Na
0119                      0119                                             Na
0133                      0133                                             Na
...
and removed all other info from the file and saved it to a file called Sol_names.txt:
0118                      0118
0119                      0119
0133                      0133
...
Then I ran GenSec4 on my Ubuntu VM and it gave me a file called Sol.sec:
0118                      0118 B9B6631-9   Fl Ni                       803 Rg
0119                      0119 B371567-9   Ni                          212 Rg
0133                      0133 C560785-7 S De Ri                       512 Rg
...
All I had to do then was paste in the names and stellar data using the vertical pasting ability of Notepad++ :
Tau1 Eridani              0118 B9B6631-9   Fl Ni                       803 Rg F6 V
Alpha Fornacis            0119 B371567-9   Ni                          212 Rg F8 IV
HR 3018                   0133 C560785-7 S De Ri                       512 Rg G0 V DA 1
...
With that done, all that was left to do was import the .sec file into Universe.
Name Calling
The first step in getting the names into Universe was to export the current data to a text file.
I exported the sector from Universe to a .sec file using a custom filter (called an .IEL file) so that my .sec file was how I wanted it in terms of field order and widths. The resulting .sec file contained all of the systems I had added, with the hex number as the name, the hex number itself, and no UWP or other data.
Next, I opened the file up in Excel as fixed width, and with my images of each subsector on my other monitor, just began doing data entry of the names for each system. Data entry was less tedious than the pen and paper method I had employed at first, since I was at least eliminating one step by going directly to my spreadsheet, but I still had to look up a lot of the stars to find out the names from the catalogues I preferred.
The SIMBAD lookup proved slow to use, but by accident I discovered that I could make batch requests with a script. Duh. Once I had figured that out, I just did the data entry for whatever display name was given for a system, regardless of catalogue, and then copied the data to a text file. I then wrote a script to give me the names I wanted:
format  object f1 "%IDLIST(SA( - );*|HR|HD|HIP|1)" +
"                                 %SP(S)" +
"\n"
format display f1
The list of names immediately proceeded the script and SIMBAD gave me back a decently formatted list of names with each star’s stellar classification.
* iot Eri                                 K0III
HD 12264                                 G5V
* alf Psc                                 A2
I then imported that into Excel and did some quick Excel magic to get the data into proper columns, and held onto for later.
Now it was time to generate all the UWP and Base data randomly.
The Best Tool for The Job
I began looking for and reviewing mapping programs a while back, even before I decided to actually create a map for Beyond Frontiers. I’ve always loved maps, and I love playing around with mapping software. There are tons of programs out there to do mapping, but I was looking for hex mapping software, which narrowed the field a bit. There were a good many programs focused specifically on Traveller that took existing .sec files and created or displayed a map, and there were other programs that focused on graphical mapping without Traveller style data in mind.
So when I decided the pencil and paper method wasn’t very efficient, I had a good idea of what was out there for me to use. Since I wanted to follow the Traveller style as I said before, I thought it best to use a Traveller focused program. Out of all the programs I had found, I narrowed it down to the big 3: Galactic, Heaven & Earth, or Traveller Universe. My main requirement was a GUI to plot systems, label them, and have their details generated randomly. I also wanted a way to keep everything in a database, and allow notes.
Galactic is an old DOS based program, so that was out right off the bat. Heaven & Earth was last touched in 2001, and wouldn’t even run in my XP VM, so I abandoned that idea. Universe remained, so that is what I used. Great way to pick software, eh? Just picking whatever is left over isn’t always the best solution, but through forum post discussions with other users and the author specifically, I determined it would work for me.
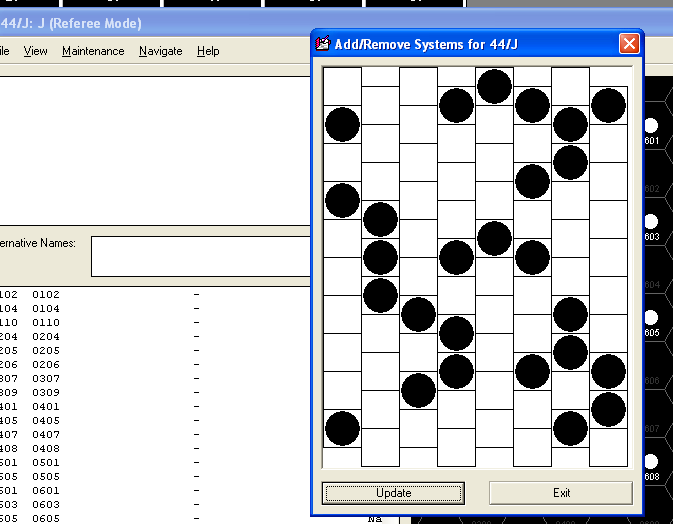
Universe couldn’t quite do exactly what I wanted, but it did have a maintenance mode to allow me to add systems manually to a subsector. So using the images of each subsector that I had created in Photoshop, I plotted each subsector until the entire sector was complete.
None of the systems had UWPs or names at this point, so the next step was to add them.
…you may think it’s a long way down the road to the chemist’s…
I started to think about how to get my hex map images into .sec files, so that any of the various and plentiful tools out there to work with and display such files would become open to me in my project. Creating .sec files would allow me to store the world locations, generate world data automatically, map out the data, create PDFs of the maps, and many other very useful things.
My first approach I thought would be the simplest. Take a pencil and paper (with pre-printed subsector grid) and start plotting the worlds based on my subsector images. It wasn’t quite that simple. First, not all the stars in the images had labels. I kept ChView open in one monitor so I could quickly select an unlabeled star and find out its name. Second, some of the stars that did have labels used catalogs such as the Bonner Durchmusterung (BD) or the Cape Photographic Durchmusterung (CP) and I wanted to try to be consistant and use HR and HD numbers for stars without Bayer or Flamsteed designations for consistency. So for those stars, I used SIMBAD to look them up and get an HR or HD number when possible.
So I began to plot out the stars on my hex paper, noting the name of the each star. Once a subsector was complete, I would then add the star spectral classification to the hex as well. For those stars I had to look up in SIMBAD, I recorded the stellar data at the same time since it was there. Otherwise I used Wikipedia if the star was present there, and SIMBAD if the star was not. I wasn’t going for complete accuracy, just rough accuracy so I wasn’t too concerned with how accurate Wikipedia was.
As you can imagine, this process was pretty tedious, because once the data was mapped on paper, I would still have to get it into a .sec file for use on the computer. So after a couple of subsectors, I decided to find an alternate method.
That’s where Universe came in.
Put A Hex On It
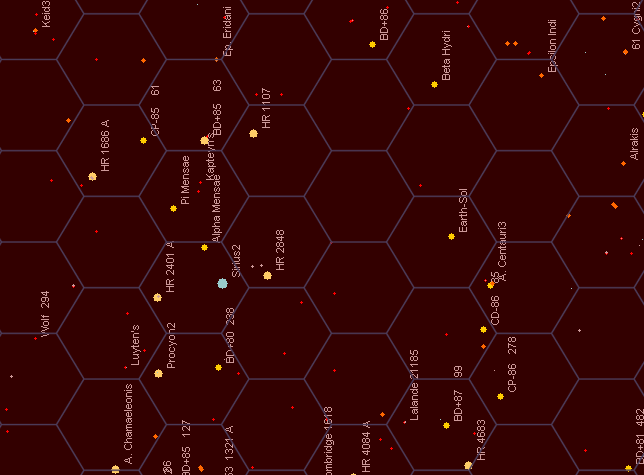
ChView gave me the raw map of stars that I needed, but it was a real pain in the arse to figure out distances, which I would need to create a good star map. I wanted to do it in the Traveller style, in a hex map, one star per hex, with each hex representing roughly one parsec. I figured the easiest way to do so would be to screenshot an area of the map, import it into Photoshop, and then layer over an appropriately sized hex grid.
So I found a site that would give me a hex grid in a custom size, and I experimented with the hex size based on the zoom level of the screenshot. I used Sol and Alpha Centauri as the rough measuring stick to figure out how big each hex should be, and then just moved the hex grid around until I was satisfied with the locations. I then drew a transparent red rectangle over the hex grid to show the size of a single subsector, for easy reference when plotting my star map.
Once I was happy with my hex grid layout, I began screenshotting each subsector in ChView and layering the hex grid on top of each one in Photoshop, cropping the image, and then saving the original .psd file with the appropriate subsector letter in a folder named for the sector. Once I had all 16 subsectors done, it was on to mapping them and creating .sec files.
In Search
I began to look around for nicely collected stellar data for stars in about a 150ly (~46pc) radius around Earth. That distance gives a Jump-2 ship at least 6 months of travel to reach the edge of the mapped flattened sphere, and a Jump-6 ship at least 2 months, and I figured that would be a good start. I found various lists containing the brightest stars, or the closest stars, but many of the brightest were too far away, and the closest stars were all too close. I found various programs that displayed known stars that weren’t a map of the night sky as seen from Earth, but there was no way to get a flattened view, or even get coordinates to map them out with.
I tried using SIMBAD to output a list of stars within 150ly, but the list was enormous. I narrowed it down a bit by excluding red dwarfs, but the list was still pretty large. I decided to try and work with it to see if I could map them out. I created an Excel spreadsheet with all the stars, their RA, Dec, and Parallax. I used some formulas found on Winchell Chung’s amazing website and calculated the celestial and galactic coordinates of each star in the list. Almost done right? Not quite.
Next I had to find software that would take my list of star names and coordinates and plot them out. I figured someone out there must have written such a program in the vast sci-fi RPG community. I did find some and after numerous failed tries using various programs, many of which were outdated, neglected, or bare bones experiments, I couldn’t find anything to do what I needed. Since I wasn’t about to do it by hand or try to write something myself, I had to take another approach.
So I started searching again.
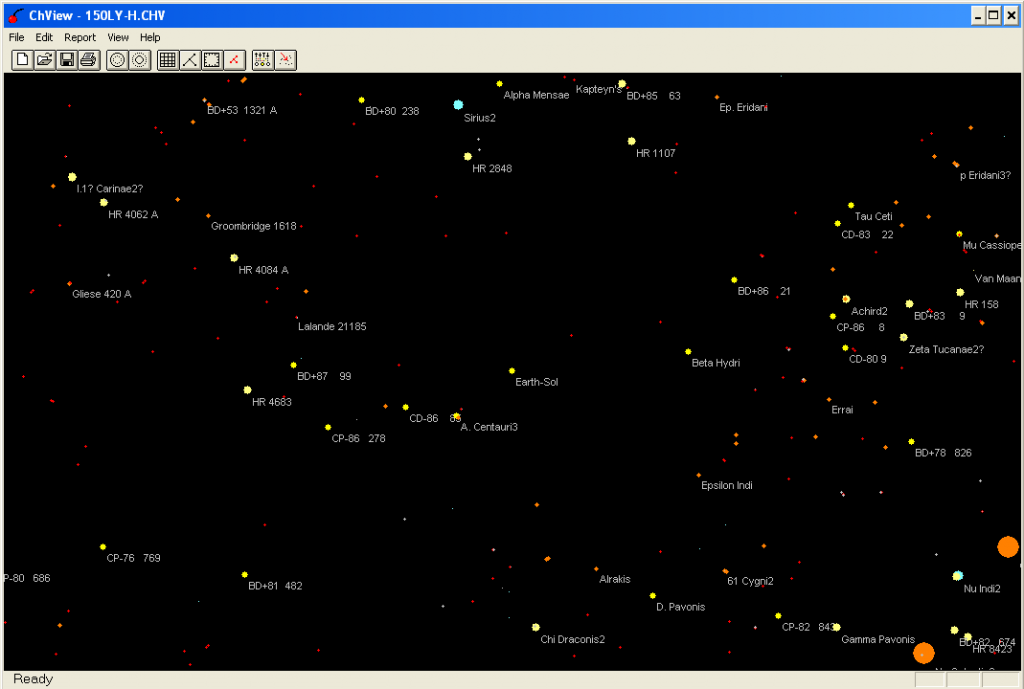
And I finally found something. And it was in a place I had been before: SolStation. I had used their Java applet, ChView, when I first started thinking about this project, but the applet was a 3-D view with no way to flatten out the Z coordinate. But they also had a PC version, which for some reason I failed to notice the first time around. Unfortunately, it was another outdated program, and it wouldn’t run on my Windows 7 laptop. Fortunately, I have a Windows XP VM on my laptop as well, so I installed it there. ChView turned out to be perfect, as it offered a data set out to 150ly (albeit 12 years old) and the default view was “top-down” , with the Z coordinate flattened.
My search was over.
In The Beginning
I’ve recently started working on mapping the Beyond Frontiers universe, and I’ve decided to chronicle the process, for my own benefit, and perhaps for the benefit of anyone else who may go through the same process.
The biggest challenge with beginning this process was that I didn’t want just a random universe. Since Beyond Frontiers is really based around Earth, I wanted to create a semi-realistic universe based on real stars. I say semi-realistic because mapping a 3-D world in 2-D can’t be completely realistic. Honestly, not many people want to worry about calculating 3-D distances when you are gaming, and creating 3-D maps is difficult at best.
So instead I decided to try to map real stars using current scientific data on their locations, and flattening the map to fit in a nice, happy, 2-D container. This was easier said than done. Getting the data for a good chunk of stars, say in about a 150 ly radius, proved to be a much bigger task than I had anticipated.


